
Title
How to customize radar chart axis labels to richtext in VChart?
Description
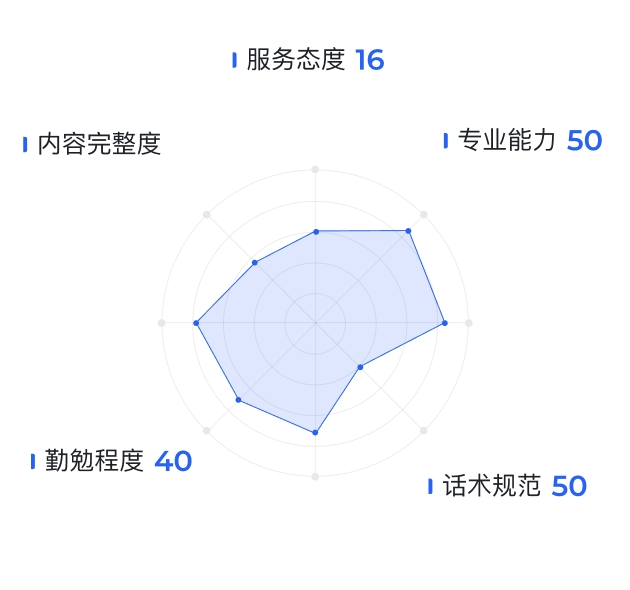
Expect to support custom icons and different text styles in labels, similar to:
Solution
First, let's analyze the requirements. The label of the **angle axis **in polar coordinates is shown in the figure.
- Add shaft configuration
In VChart, you can configure the axis through theaxesproperty.Axesreceives an array, adds an item, and sets the axis type ofaxes [0].type: 'angle'to angle axis; - Configuration axis label
Configureaxes [0].labelto rich text by formatting functionformatMethod.
formatMethodreturns a configuration object with rich text content Type: 'rich': defines the return text type as rich textText: Detailed configuration of rich text. Supports two types of text and image. Detailed configuration can refer to the configuration item document .
formatMethod: (value, data, c, d) => {
  return {
    type: "rich",
    text: [
      {
        image:
          '<svg t="1714116158819" class="icon" viewBox="0 0 1228 1024" version="1.1" xmlns="http://www.w3.org/2000/svg" p-id="19433" width="200" height="200"><path d="M1152 76.8v870.4h-1075.2v-870.4h1075.2M1228.8 0H0v1024h1228.8V0z" fill="#0686E5" p-id="19434"></path><path d="M0 0h1228.8v1024H0z" fill="#0686E5" p-id="19435"></path></svg>',
        width: 2,
        height: 10,
      },
      {
        text: ` ${value} `,
        fontSize: 16,
        fill: "black",
        fontWeight: "bold",
      },
      {
        text: ` ${values.find((v) => v.key === value)?.value} `,
        fontSize: 16,
        fill: "rgb(22,100,255)",
        fontWeight: "bold",
      },
    ],
  };
},</br>
Code Example
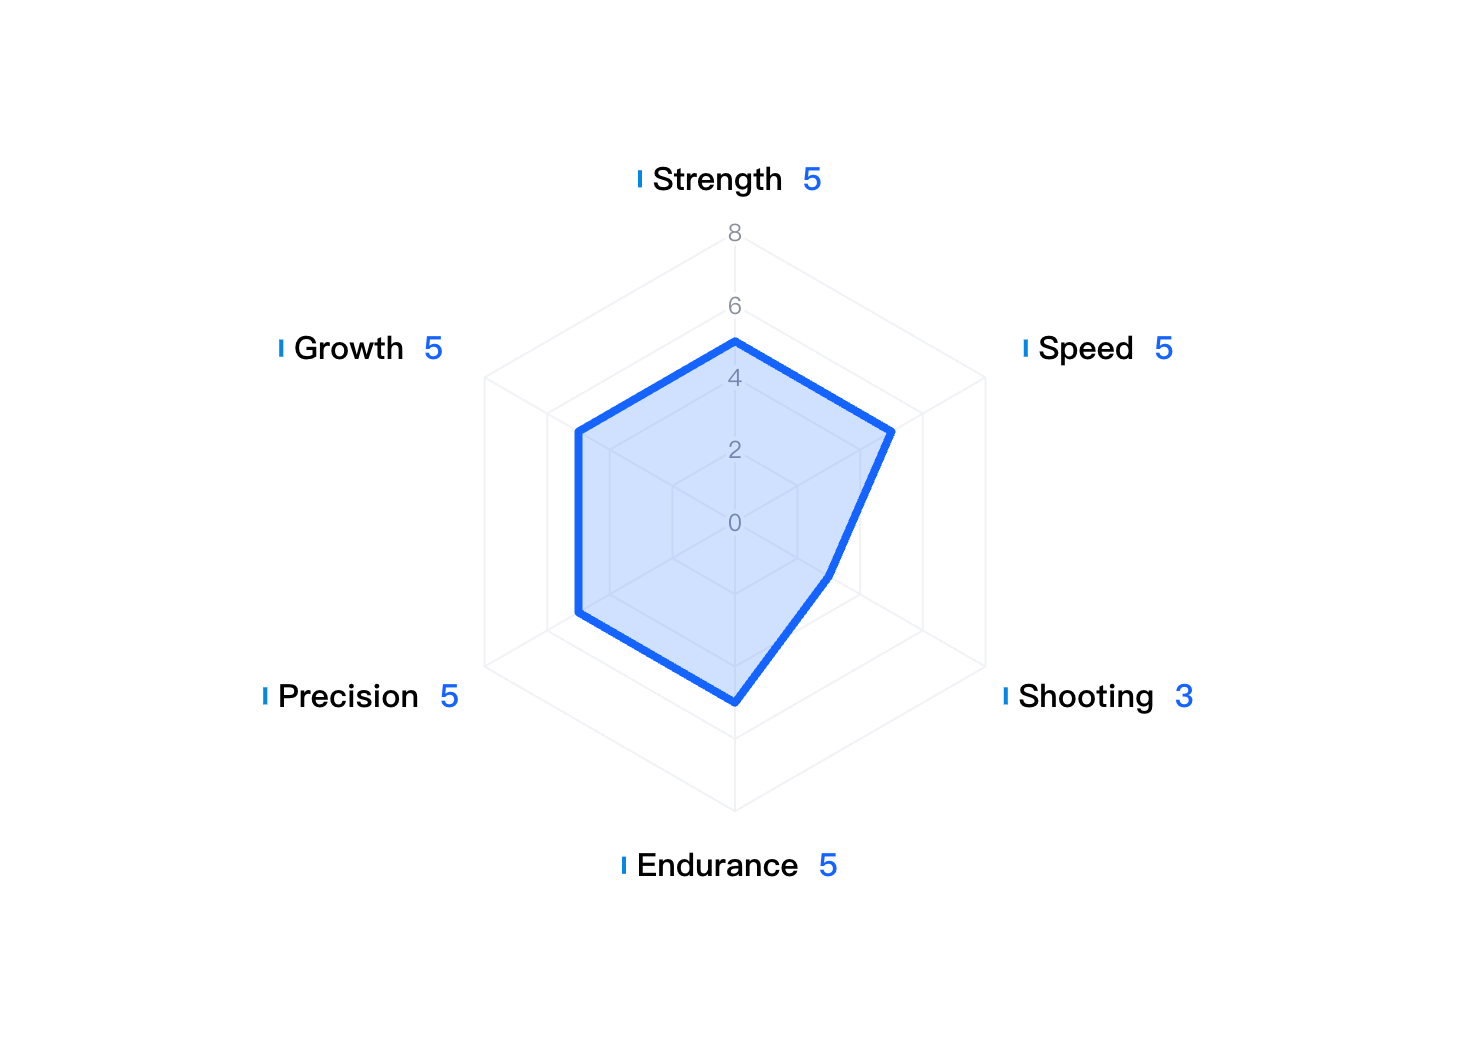
const values = [
        {
          key: 'Strength',
          value: 5
        },
        {
          key: 'Speed',
          value: 5
        },
        {
          key: 'Shooting',
          value: 3
        },
        {
          key: 'Endurance',
          value: 5
        },
        {
          key: 'Precision',
          value: 5
        },
        {
          key: 'Growth',
          value: 5
        }
      ];

const spec = {
  type: 'radar',
  data: [
    {
      id: 'radarData',
      values
    }
  ],
  categoryField: 'key',
  valueField: 'value',
  point: {
    visible: false // disable point
  },
  area: {
    visible: true, // display area
    state: {
      // The style in the hover state of the area
      hover: {
        fillOpacity: 0.5
      }
    }
  },
  line: {
    style: {
      lineWidth: 4
    }
  },
  axes: [
    {
      orient: 'radius', // radius axis
      zIndex: 100,
      min: 0,
      max: 8,
      domainLine: {
        visible: false
      },
      label: {
        visible: true,
        space: 0,
        style: {
          textAlign: 'center',
          stroke: '#fff',
          lineWidth: 4
        }
      },
      grid: {
        smooth: false,
        style: {
          lineDash: [0]
        }
      }
    },
    {
      orient: 'angle', // angle axis
      zIndex: 50,
      tick: {
        visible: false
      },
      domainLine: {
        visible: false
      },
      label: {
        space: 20,
         formatMethod: (value, data,c,d) => {
          console.log(value,data,c,d)
      return {
        type: 'rich',
        text: [
          {
            image: '<svg t="1714116158819" class="icon" viewBox="0 0 1228 1024" version="1.1" xmlns="http://www.w3.org/2000/svg" p-id="19433" width="200" height="200"><path d="M1152 76.8v870.4h-1075.2v-870.4h1075.2M1228.8 0H0v1024h1228.8V0z" fill="#0686E5" p-id="19434"></path><path d="M0 0h1228.8v1024H0z" fill="#0686E5" p-id="19435"></path></svg>',
            width: 2,
            height: 10
          },
          {
            text: ` ${value} `,
            fontSize: 16,
            fill: 'black',
            fontWeight: 'bold'
          },
           {
            text: ` ${values.find(v => v.key === value)?.value} `,
            fontSize: 16,
            fill: 'rgb(22,100,255)',
            fontWeight: 'bold'
          }
        ]
      };
    }
      },
      grid: {
        style: {
          lineDash: [0]
        }
      }
    }
  ]
};

const vchart = new VChart(spec, { dom: CONTAINER_ID });
vchart.renderSync();

// Just for the convenience of console debugging, DO NOT COPY!
window['vchart'] = vchart;</br>
Related Documentation
richtext demo:https://visactor.io/vchart/demo/label/richtext-label
Related api:https://visactor.io/vchart/option/radarChart-axes-band#label.formatMethod
github:https://github.com/VisActor/VChart